
Build a Smart Expense Tracker with Data Visualization: Python Tutorial | AI Valley Panchkula
Welcome to another exciting, hands-on tutorial from AI Valley, the premier destination for tech education! At AI Valley in Panchkula, students build real-world, highly practical projects like this every single week. Today, we are diving into the fascinating world of Python programming and Data Science by creating something everyone needs: a Personal Expense Tracker.
Whether you are a young student looking to manage your pocket money, a college scholar organizing a monthly allowance, or an adult wanting to track household bills, this project is perfectly tailored for you. Not only will you write Python code to store your financial data safely, but you will also use powerful, industry-standard libraries to generate beautiful, interactive pie charts of your spending habits.
If you have been searching for the best coding classes for kids in Panchkula or a reliable place to learn foundational Python in the Tricity area, you are in exactly the right place! Let's experience the AI Valley difference and get coding.
🎯 What You Will Build Today
By the end of this comprehensive tutorial, you will have built a fully functional, highly robust Smart Expense Tracker that runs directly in your computer's terminal. Your application will allow you to:
- Enter daily expenses: Log categories like Food, Transport, Bills, and Entertainment.
- Save data permanently: Write your data to a CSV file (which opens just like a standard Excel spreadsheet).
- View mathematical summaries: Automatically group and calculate your total spending by category.
- Generate data visualizations: Automatically pop up a colorful, mathematically accurate Pie Chart showing exactly where your money is going.
This is exactly the kind of interactive, logic-driven, real-world project our students build when they join our foundational tech programs.
📋 Prerequisites & Materials
Before we begin writing our script, you will need a few essential software tools. If you don't have a computer at home, don't worry! You can always visit AI Valley's Zirakpur or Panchkula labs where all materials are provided, and our lab computers are pre-configured with industry-standard software.
To code along at home, ensure you have: Python 3.10+ installed on your computer. (You can download it for free from python.org). VS Code (Visual Studio Code) or any text editor of your choice (like PyCharm or Sublime Text). Internet Connection to download the required Python Data Science libraries. A basic understanding of Python variables and functions (though we will explain every single line step-by-step!).
---
Step 1: Setting Up Your Professional Python Environment
Before we can write our expense tracker, we need to bring in some heavy-lifting tools. In the software engineering world, we use "libraries"—pre-written bundles of code that give us superpowers without having to reinvent the wheel.
For this project, we will be using Pandas (the global standard for managing data like a spreadsheet) and Matplotlib (the foundational library for drawing beautiful charts). Data Scientists at companies like Google, Netflix, and Amazon use these exact same libraries every single day.
If you are researching the best coding classes for kids in Mohali or Zirakpur, you will find that our curriculum at AI Valley always starts with teaching students how to properly manage their coding environments. It is a vital, non-negotiable software engineering skill!
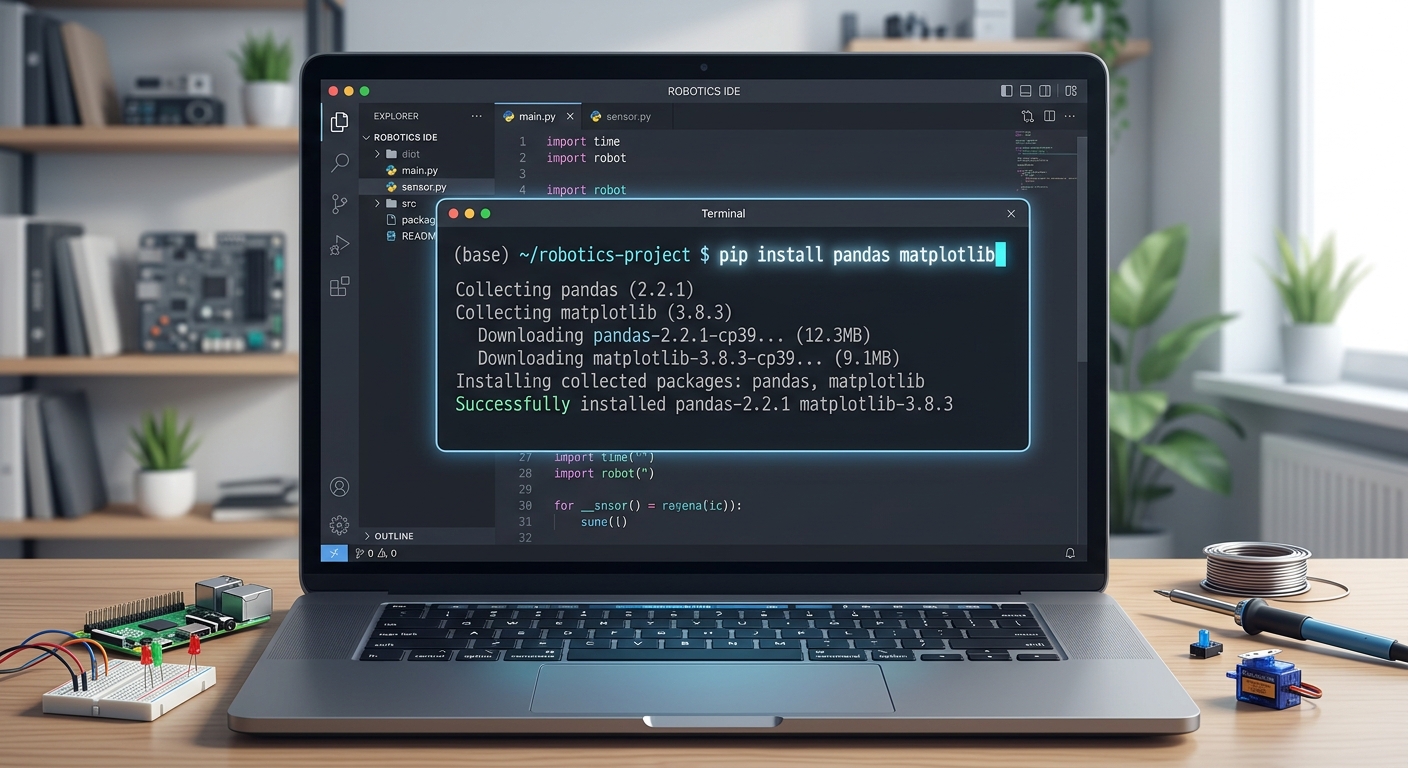
A screenshot of a computer terminal inside VS Code showing the user typing the pip install pandas matplotlib command.
Open your VS Code terminal (Click Terminal > New Terminal in the top menu) and run the following command to securely install these libraries:
Once the installation finishes, create a new Python file named expense_tracker.py and type the following code at the very top:
🧠 How It Works:
import pandas as pd: We are importing pandas and giving it the nickname pd to save us from typing the full word every time.
import matplotlib.pyplot as plt: This imports the plotting module, nicknamed plt.
import os: The Operating System library helps Python talk to your computer to check if files exist.
from datetime import date: We import this so our app can automatically detect today's date, saving the user from typing it manually!Right now, if you run the file, nothing will happen visually. However, behind the scenes, Python is quietly loading these massive libraries into your computer's memory, preparing for the work ahead.
---
Step 2: Creating the Intelligent Data Loader
We want our application to remember our expenses even after we close it. To achieve this, we need a function that checks if our CSV (Comma Separated Values) file exists. If it does, we load the data. If it doesn't, we create a fresh, empty data structure called a DataFrame.
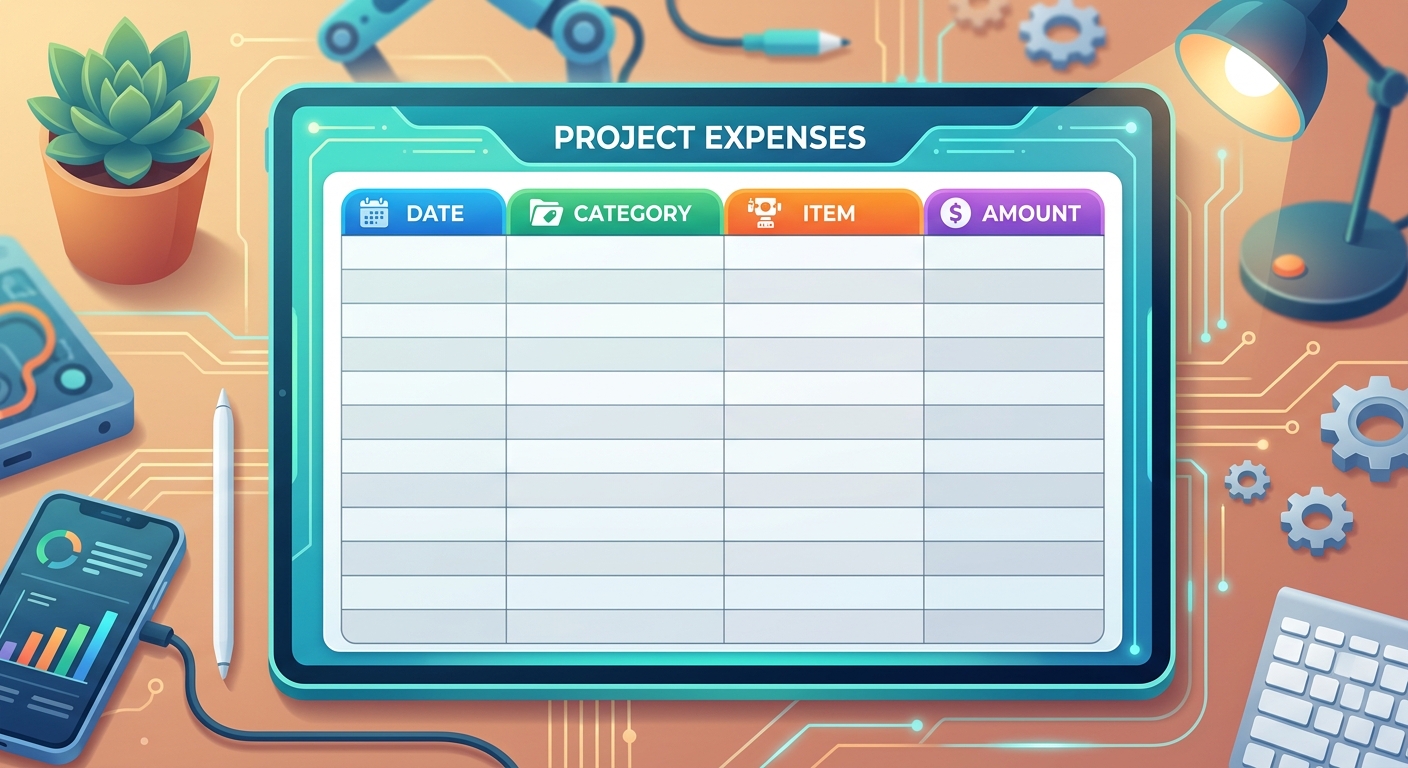
A diagram showing an empty spreadsheet with four columns: Date, Category, Item, and Amount.
Add this function below your imports in your expense_tracker.py file:
🧠 How It Works:
Theos.path.exists(FILE_NAME) command acts like a scout, checking your folder for my_expenses.csv. If it finds the file, pd.read_csv() reads it into memory. If the file is missing (which it will be on your very first run), pd.DataFrame() creates a blank table in the computer's memory with four specific column headers.As a cornerstone of STEM education Tricity standards, learning to manage persistent data safely is a massive leap forward for beginners.
---
Step 3: Building the Expense Saving Logic
Now we need a mechanism to take the user's input (how much they spent, and on what) and securely save it into our file. This is exactly the kind of logical flow our students build during their weekend Python modules.
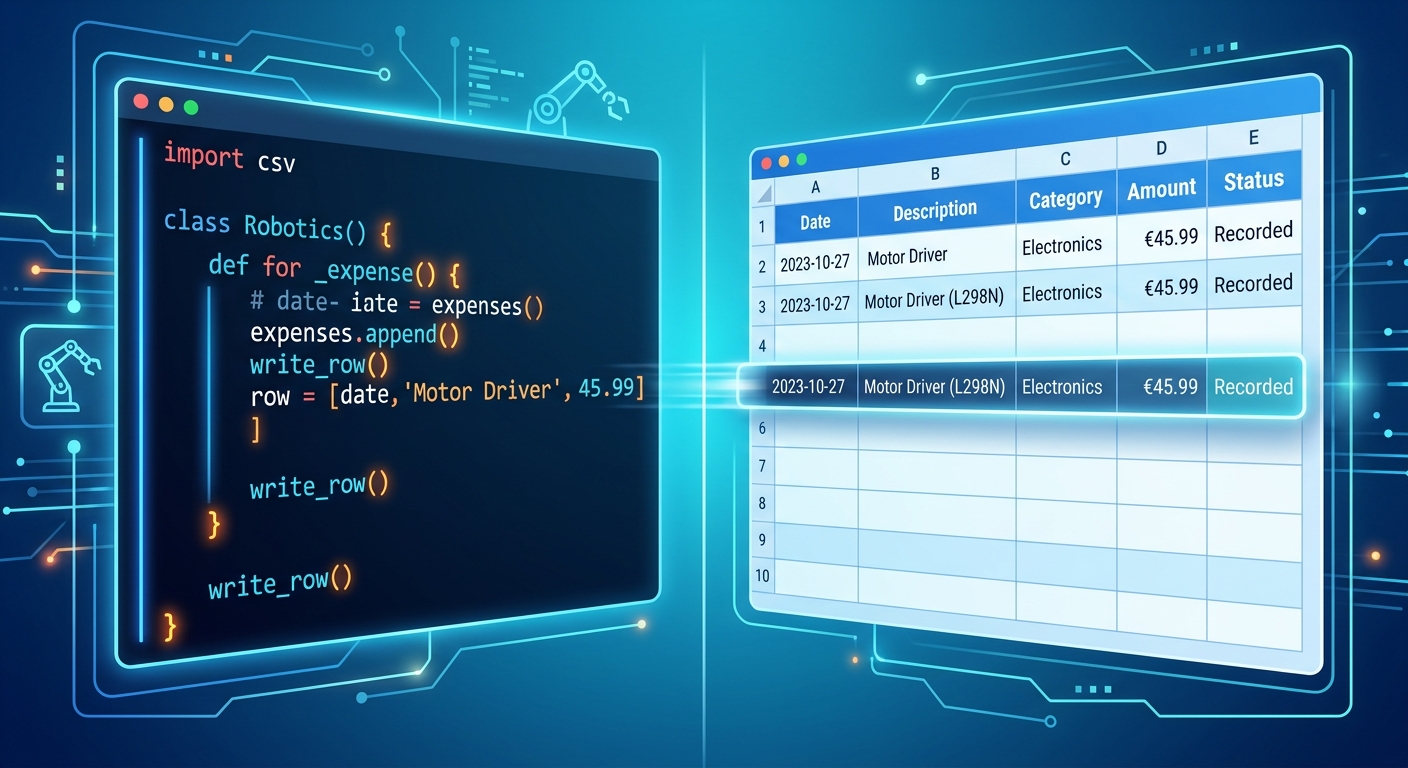
A split screen showing Python code on the left and a representation of data being added as a new row to a spreadsheet on the right.
Add this next block of code to your file:
🧠 How It Works:
This function accepts four crucial pieces of information as arguments. First, it loads the existing database. Next, it creates a new "row" of data formatted as a Pandas DataFrame. We usefloat(amount) to ensure the money is saved as a decimal number (like ₹45.50), not just raw text.We then use pd.concat() to attach this new row to the bottom of our existing data. Finally, to_csv(FILE_NAME, index=False) permanently saves it to your hard drive without adding messy, unnecessary row numbers to the file.
---
Step 4: Generating the Expense Summary
Tracking data is useless if you cannot analyze it! Let's build a function that calculates exactly how much money has been spent in each category.
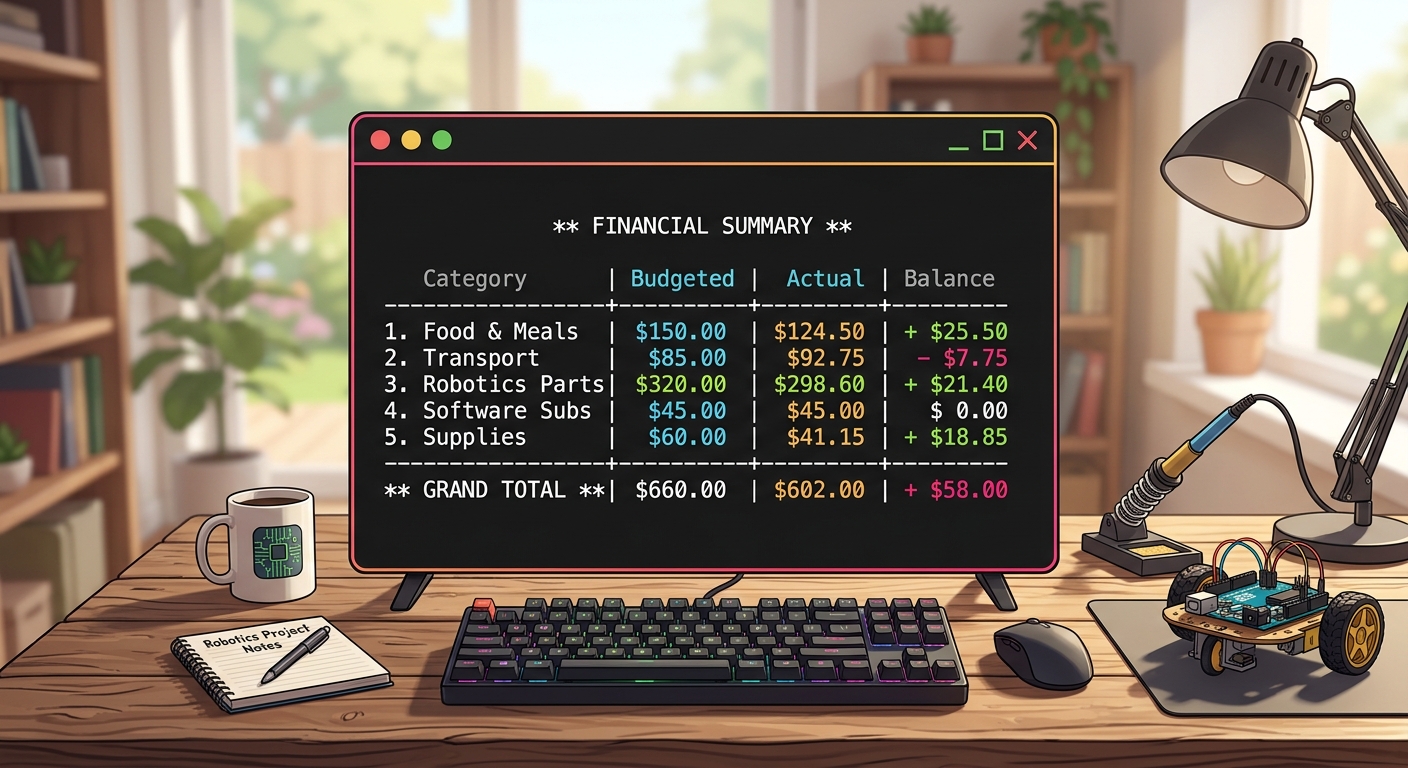
A screenshot of a computer terminal displaying a text-based summary of expenses grouped by category, with a total amount at the bottom.
Add the following code:
🧠 How It Works:
Here, we use the Pandas.groupby() function. This is a massively powerful Data Science tool, equivalent to the GROUP BY command in SQL databases. It looks at all your rows, groups identical categories together (like putting all "Food" receipts into one virtual bucket), and uses .sum() to add up their amounts. It then prints a nicely formatted text receipt to your screen.---
Step 5: Visualizing Data with a Colorful Pie Chart
Numbers are great, but visuals are far better! Let's use Matplotlib to draw a colorful, accurate pie chart. When parents search for the best coding classes for kids in Chandigarh or nearby areas, they are usually looking for high-quality programs that teach these exact modern visualization skills, moving beyond basic text games.
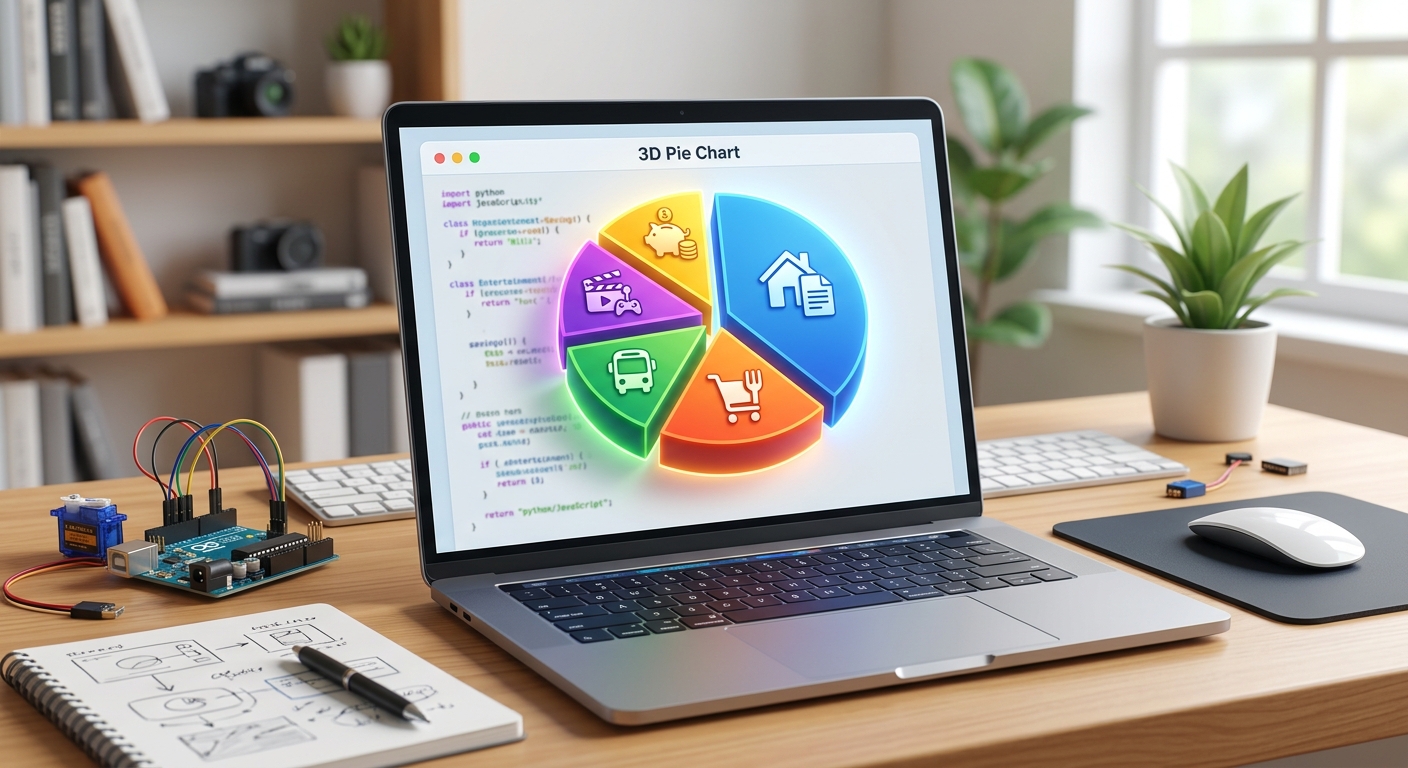
A bright, colorful pie chart popping up in a graphical window, dividing expenses into slices like Food, Transport, and Bills.
🧠 How It Works:
We group the data exactly like we did in Step 4. Then,plt.figure() sets the graphical window size. The plt.pie() command does the heavy lifting, taking our data and automatically calculating the mathematical percentages (autopct='%1.1f%%') to draw accurate slices. Finally, plt.show() opens a pop-up window to display the graphic directly to the user!---
Step 6: Creating the Interactive Menu
Finally, we need a way for the user to control the application. We will build a "While Loop" that acts as our main menu, keeping the app running continuously until the user specifically decides to quit.
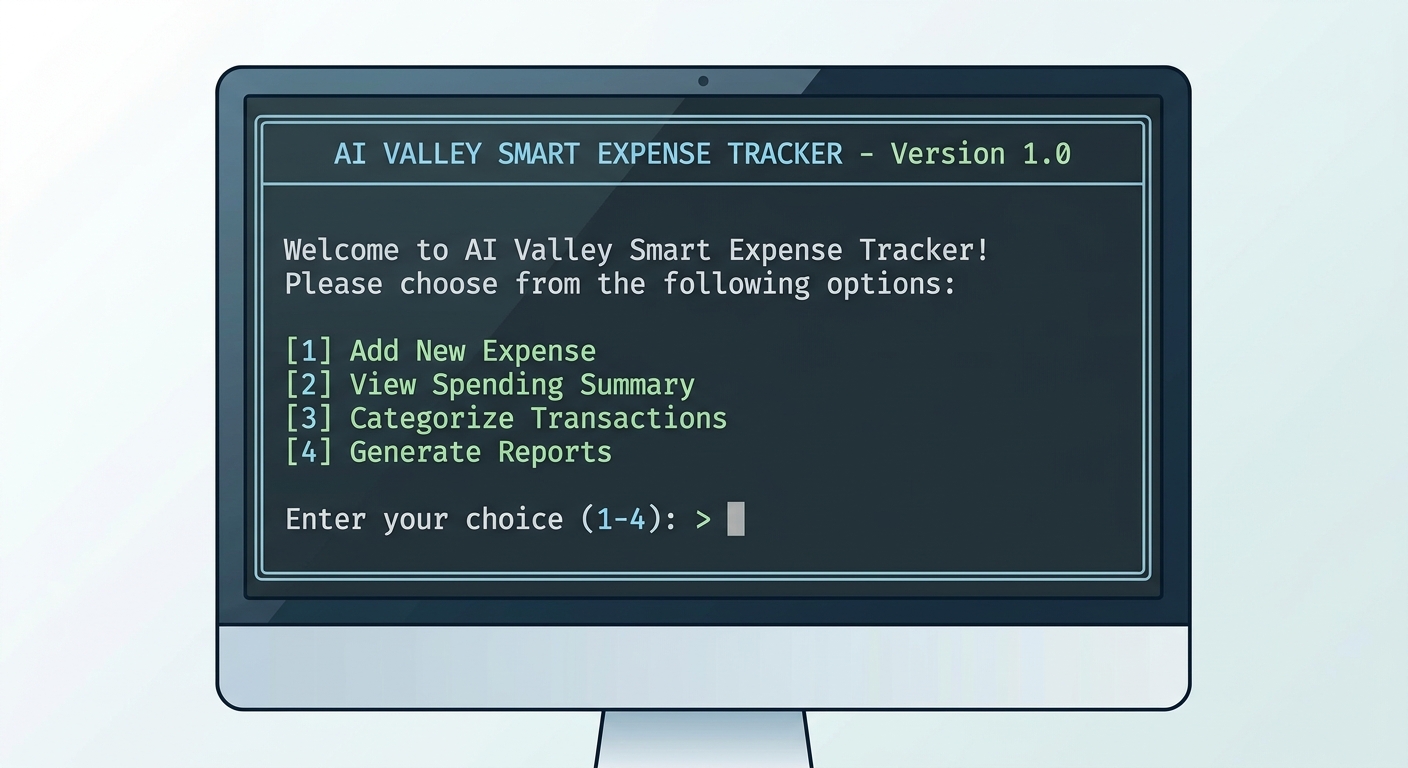
A screenshot of the final terminal interface showing the 1-4 menu options waiting for the user's input.
🧠 How It Works:
Thewhile True: loop ensures the menu keeps reappearing after every action. The input() functions gather data typed by the user.Notice the try...except ValueError: block? That is a crucial software engineering feature called Error Handling! If a user accidentally types the word "fifty" instead of the number "50" for their amount, the float() conversion in Step 3 will fail. Instead of crashing the entire program and throwing an ugly red error, our app gently catches the error and warns the user nicely.
The final if __name__ == "__main__": block is a Python standard. It simply means: "If I am running this file directly, start the main() function."
---
🎉 Final Result
Congratulations! You have successfully built a fully functional Smart Personal Expense Tracker from scratch. By following this tutorial, you haven't just copied code—you have learned how to structure robust applications, handle persistent data storage with CSVs, utilize powerful libraries like Pandas, and visualize complex data using Matplotlib.
These are not just basic concepts; these are the exact foundational techniques used by professional Data Scientists globally. Mastering these tools through our hands-on projects sets students up for unparalleled future success in the tech industry.
🚀 Challenge: Take It Further
Ready to level up your code? Here are a few ways to upgrade your new application on your own:
---
🏫 Learn More and Enroll at AI Valley
AI Valley is incredibly proud to be the top-rated coding and robotics institute serving brilliant minds across Chandigarh, Mohali, Zirakpur, and Panchkula. Our expert instructors teach hands-on, project-based classes just like this one every single week, ensuring that our students don't just memorize theory—they build real, working products.
Whether your child is taking their very first steps into the world of tech, or you are looking for the absolute best coding classes for kids in Zirakpur and the wider Tricity area, we have the perfect, customized learning path waiting for you. From beginner block-coding to advanced Artificial Intelligence, Machine Learning, and Python software development, our curriculum is designed to create tomorrow's tech leaders.
Ready to transform your screen time into skill time? Visit aivalley.co.in to explore our curriculums, or Enroll at AI Valley today by visiting our state-of-the-art labs. Let's build the future together, one line of code at a time!